
Apps4.Pro has introduced a new feature to generate the Summary Report across all VMs in Power BI format for the below workloads. This gives a visualization on the Summary of the Jobs & the Migrated data across the VMs.
- SharePoint Migration
- Teams Migration
- Private Chat Migration
Please follow the below mentioned steps to generate the same.
Pre-requisites
- Choose the storage location :
From the Storage Settings in the Apps4.pro Migration Manager tool
- Select between Source or Target Tenant
- Select the required Office365 Group listed
- Sync-up the data across VMs : Sync manually to get the latest migration data from all the instances reflect in the configured Office365 Group
- Generate Report : Generate “All VMs Summary – Detailed” Report from any of the Instance/VM.
For a detailed explanation on the above steps, please refer this FAQ –https://support.apps4.pro/apps4pro-migration-manager-general-queries-get-summary-report-across-machines
Generate Power BI Report
We will now see how to generate the Summary Report in Power BI format.
We have considered for e.g., ‘Teams Migration’ to depict the same.
Step 1
Download the sample Power BI Report file from the below link:
https://cdn.apps4.pro/setup/all-vms-team-summary-detailed-report.pbix
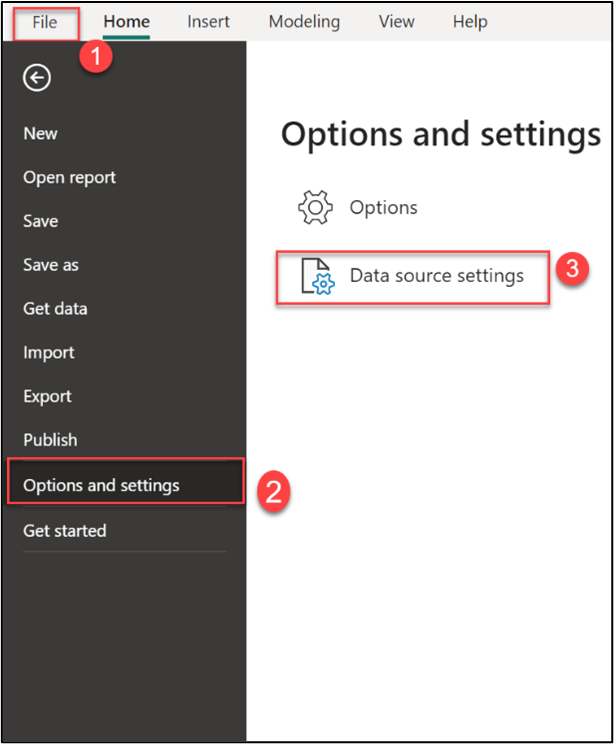
Step 2
From Power BI Desktop app, open the downloaded Power BI file and then go to Data source settings.
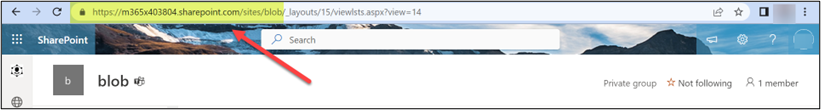
Step 3
From the SharePoint portal, Copy the SharePoint Site URL associated with the Office 365 Group selected in the above mentioned step.
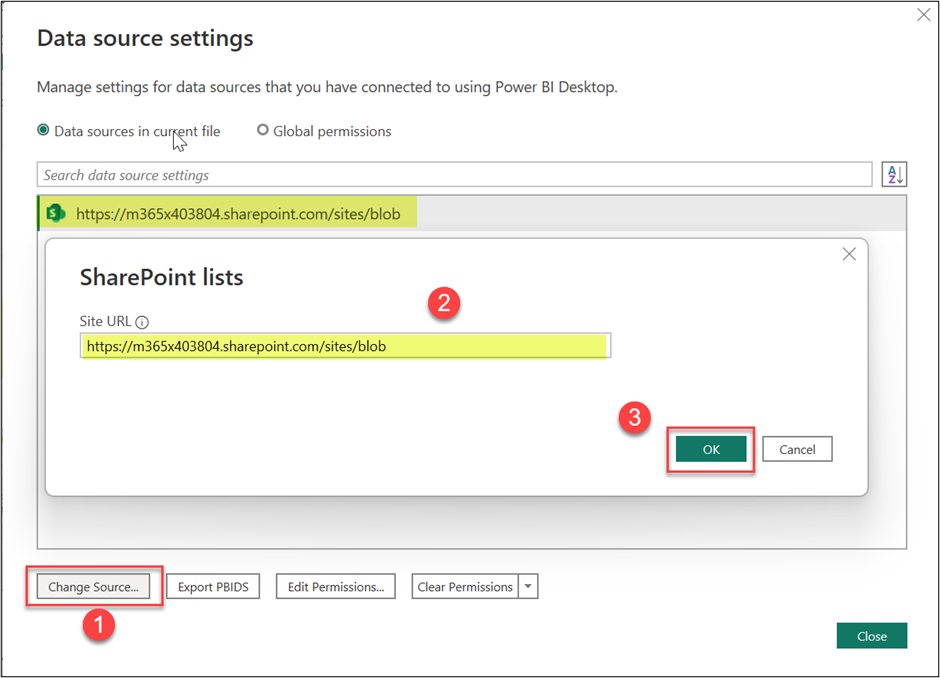
Step 4
Enter the URL we copied from Step 3
Step 5
Edit Permissions in the Data source settings as below
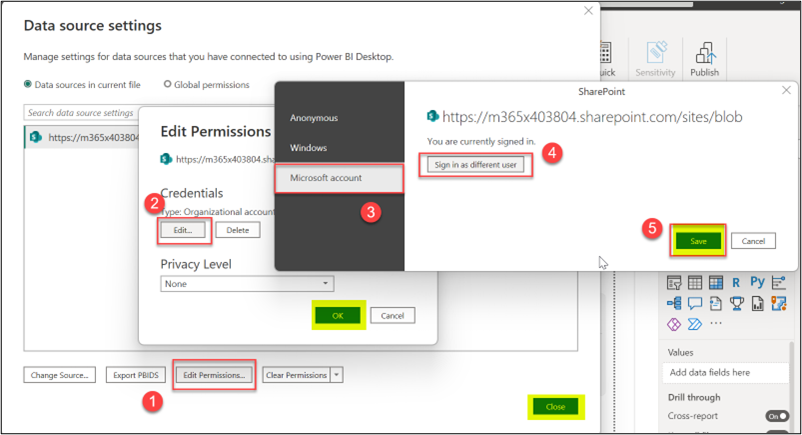
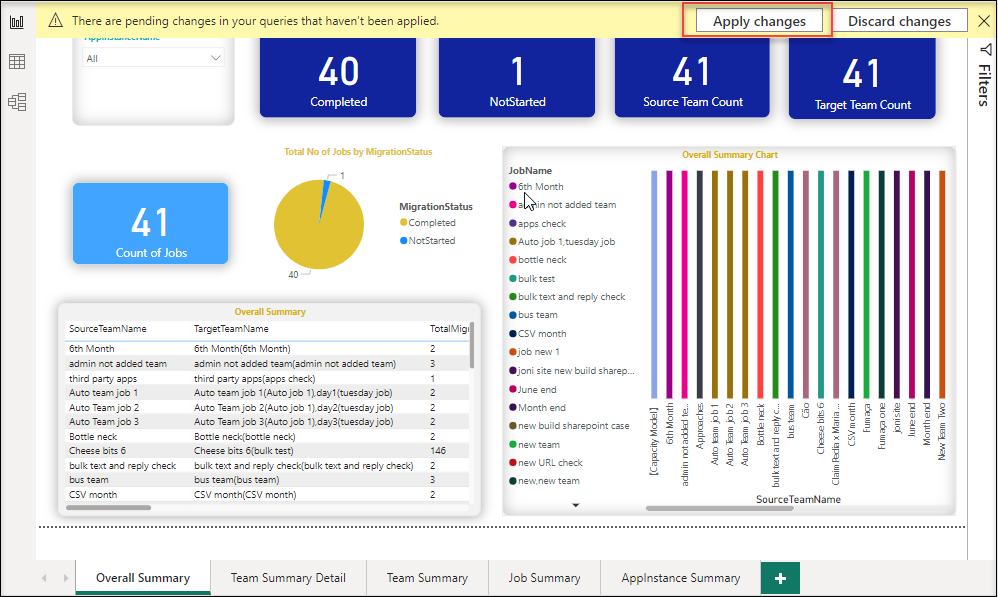
Step 6
Go to the reports page of Power BI and click Apply Changes to get the updated charts.
Step 7
You can publish this report to share with your users.